I built the local agent bridge from the first post in this series and the post on building one in a day. Loopback listener, token check, context compilation, a failure taxonomy with six status codes instead of one generic 500. A test suite of ninety six cases, all passing. Then I pointed a real client at it and used it for an afternoon, not a load test, not a fuzzer, just the ordinary traffic one person generates asking a coding agent to draft things in their own voice. Three bugs surfaced in that afternoon that the suite had never once failed on.
A test-blind bug is a bug that exists only in the difference between the conditions a test suite creates and the conditions reality creates. The code is not wrong, and the suite is not thin. The suite exercises a warm cache, a compile under budget, an error path taken on purpose, and reality supplies a different one. It differs from an ordinary coverage gap because writing more tests of the same shape would not have found it.
None of the three were exotic. A compile that could blow past its own budget. A health check that did the work it was supposed to be checking. An error that told a caller nothing they could use. What made them worth writing up is not the bugs themselves, it is that the suite was green through every one of them, right up until a real request hit the exact condition the tests never happened to construct.
Say the size of this plainly before anything else. Three bugs from one afternoon of use is not a study. It is not a sample large enough to generalize from, and it does not tell you how common this class of failure is in agent bridges generally, or in software generally, or even in this one bridge over a longer stretch of time. What it can tell you, honestly, is narrower and more useful than a study would be anyway: here is what your tests will not catch, demonstrated three separate times in one sitting. That is the claim this post makes. It is not production wisdom, and it is not a verdict on testing as a practice. It is a description of a gap, observed directly, between what a suite of tests constructs and what one afternoon of real use ran into.
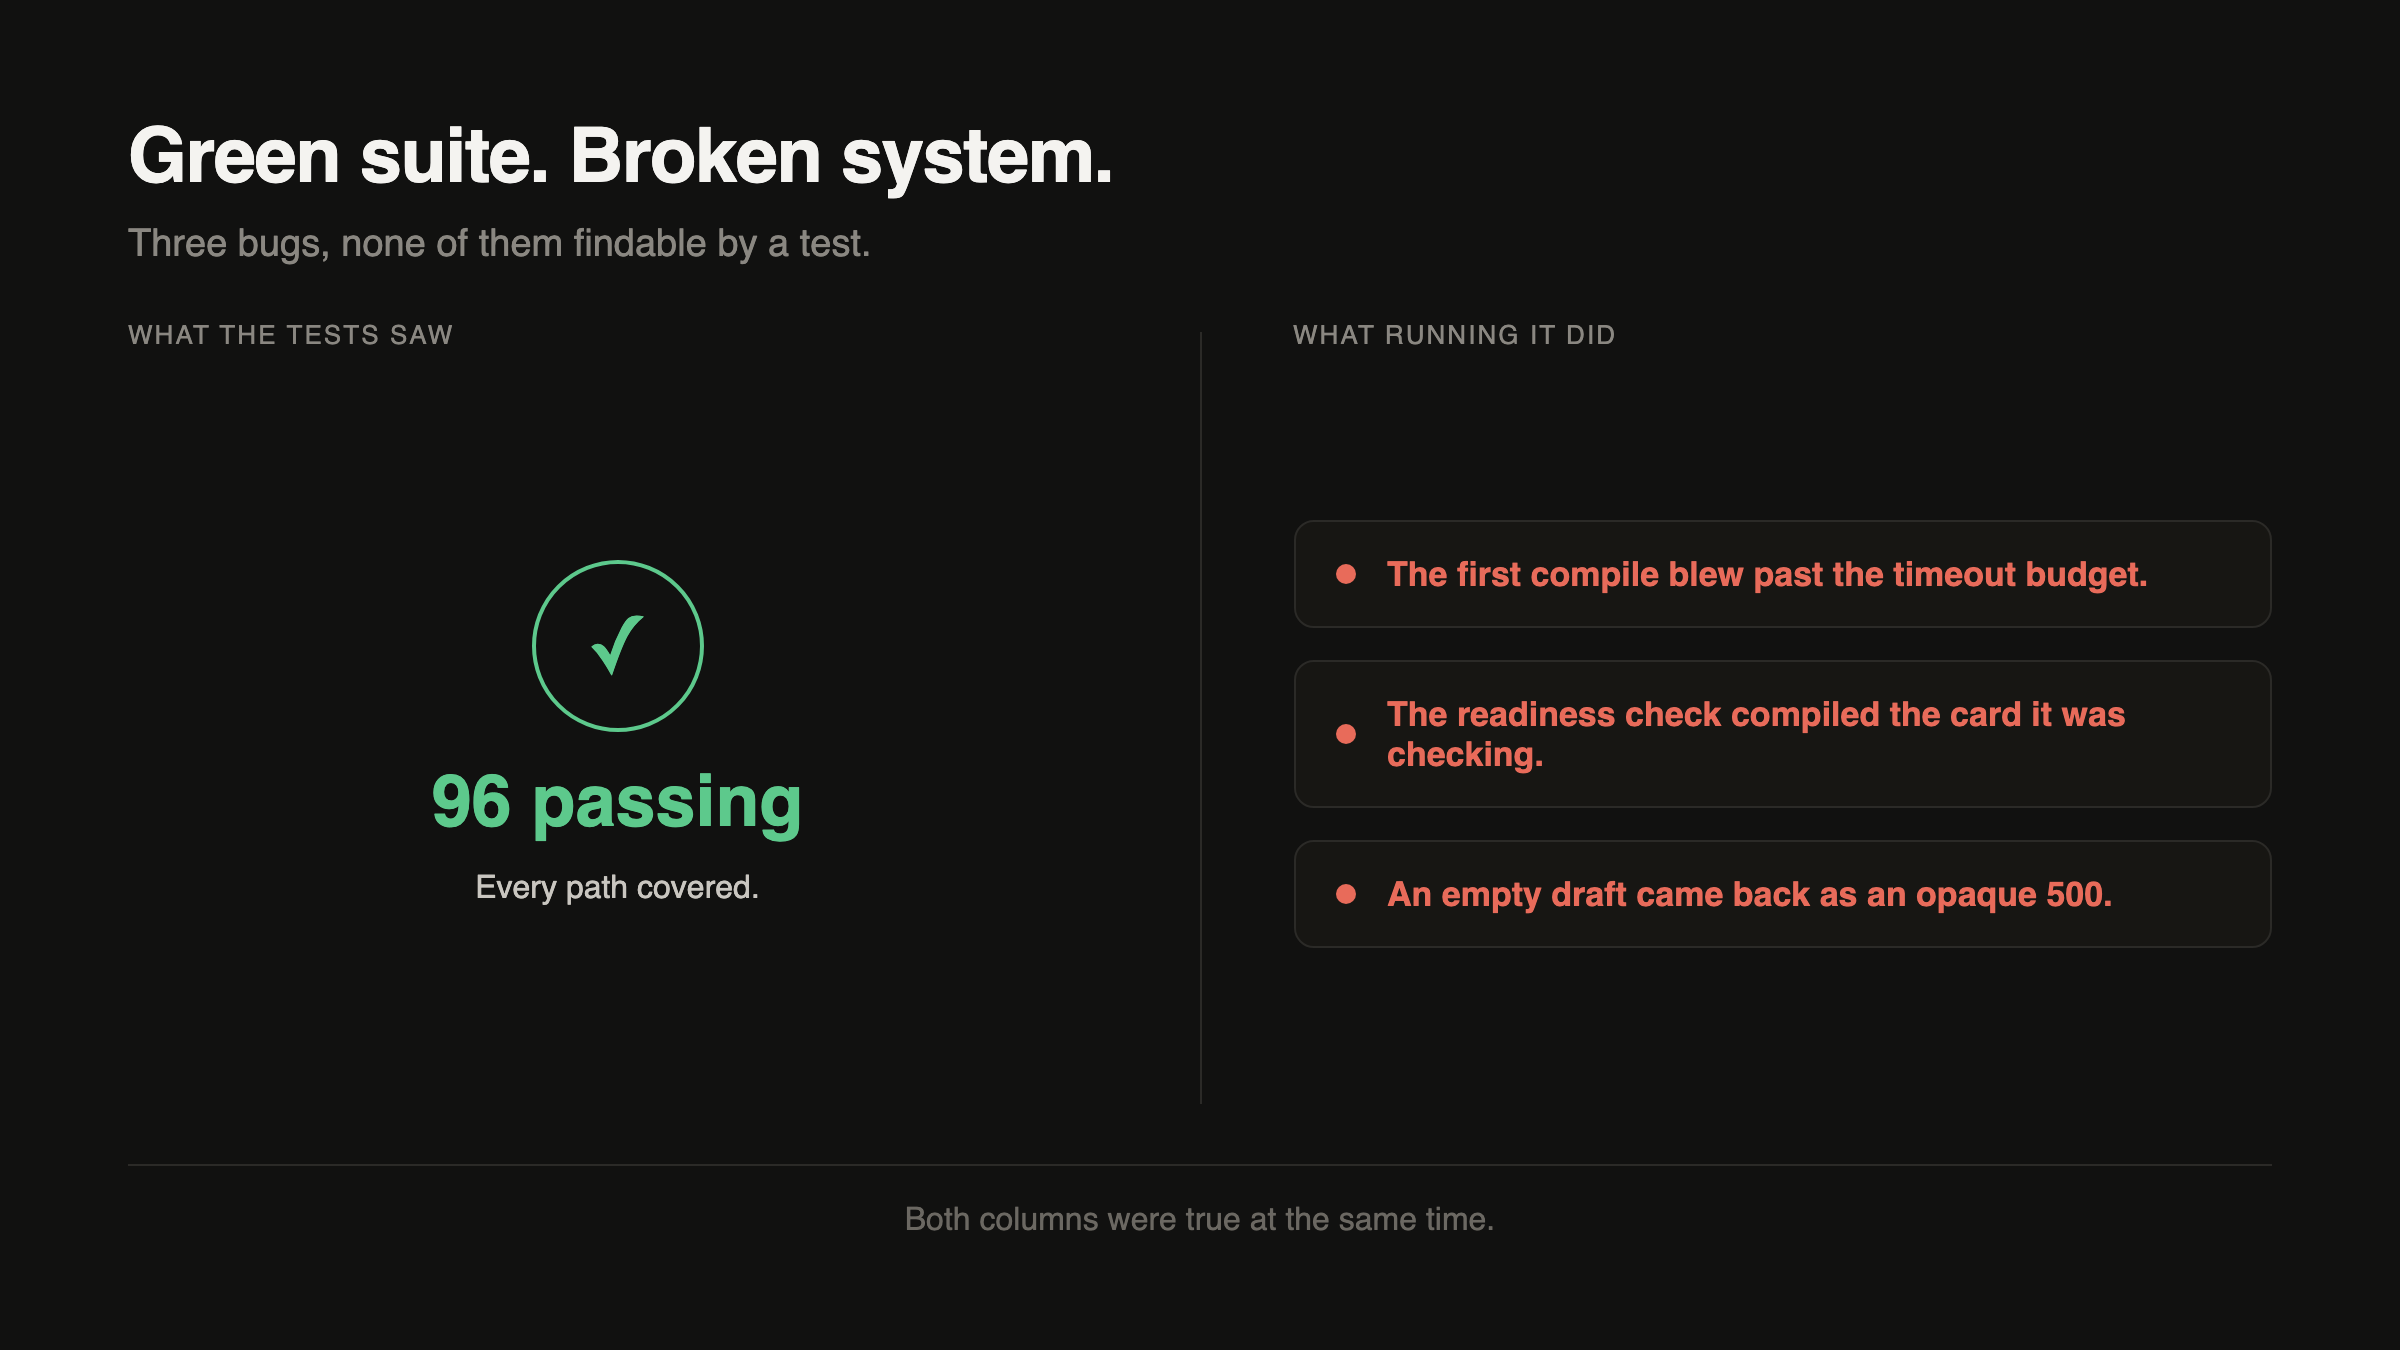
Table of Contents#
- What does a green test suite actually prove?
- Why did a passing timeout test hide a real timeout bug?
- What happens when a readiness check does the work it is checking?
- Why is a 500 worse than the error it replaced?
- What do these three have in common?
- How would you catch this class of bug?
- FAQ
What does a green test suite actually prove?#
A green test suite proves that every scenario it encodes still behaves the way it did the day someone wrote the assertion for it. It does not prove the system works. It proves the system matches a fixed set of expectations about a fixed set of conditions, and those two claims sound close enough to swap for each other until an unencoded condition shows up. Ninety six passing tests describe ninety six scenarios someone thought to write down, not the full space of scenarios a real caller can produce. A cold cache is a condition. A slow compile is a condition. A model returning something unusable is a condition. If none of the ninety six tests constructs that exact condition, the suite has nothing to say about it, and it keeps passing straight through a request that fails in production for a reason it was never asked to check. Green means the map matches the roads someone drew, nothing about the road nobody drew.
That is not a small caveat, it is the entire shape of what happened over one afternoon. Every one of the three bugs below passed cleanly in the suite and failed on the first real request that happened to land outside the ninety six roads. The suite was not lying. It was answering a narrower question than the one that mattered.
Why did a passing timeout test hide a real timeout bug?#
The first context card compile, the one built when nothing is cached yet, takes somewhere between 60 and 120 seconds. That range came directly from watching it run, not from a spec sheet. The bridge's per-request budget, the ceiling applied to a full request from authentication through the agent invocation and back, was set to 90 seconds, and 90 sits inside 60 to 120 rather than above it. That single fact is the entire bug. A compile that happened to finish before the 90 second mark let the request through and the test passed. A compile that happened to finish after it tripped the budget and the request failed. Nothing in the code changed between those two outcomes. Only the wall clock did.
It would be tidy to say a longer harness timeout was quietly masking this the whole time, papering over slow runs so nobody noticed. That is not what happened, and it is worth being precise about why. No harness in this project runs anywhere near that long: the bridge's own test script allows 180 seconds and the repository root allows 600, both of which exist to give a test runner enough room to start processes and finish assertions, not to absorb a budget the bridge enforces against itself. A harness timeout governs how long a test runner will wait for the suite to finish. It has no way to reach inside a request and change the number the bridge compares a compile's duration against. Those are two different clocks measuring two different things, and conflating them would blame a bug on a number that never touched it.
The real story is smaller and more instructive than a masked timeout would have been. The suite was sampling a distribution, not testing a boundary. Every time a test's compile happened to land in the fast half of the 60 to 120 range, the assertion passed and the suite reported success. Every time it happened to land in the slow half, the same assertion would have failed, and it did fail, intermittently, in exactly the way a coin flip is intermittent. A suite that passes most of the time on a request whose duration crosses its own budget roughly half the time is worse than a suite that fails consistently, because a consistent failure gets investigated and a suite reporting success does not.
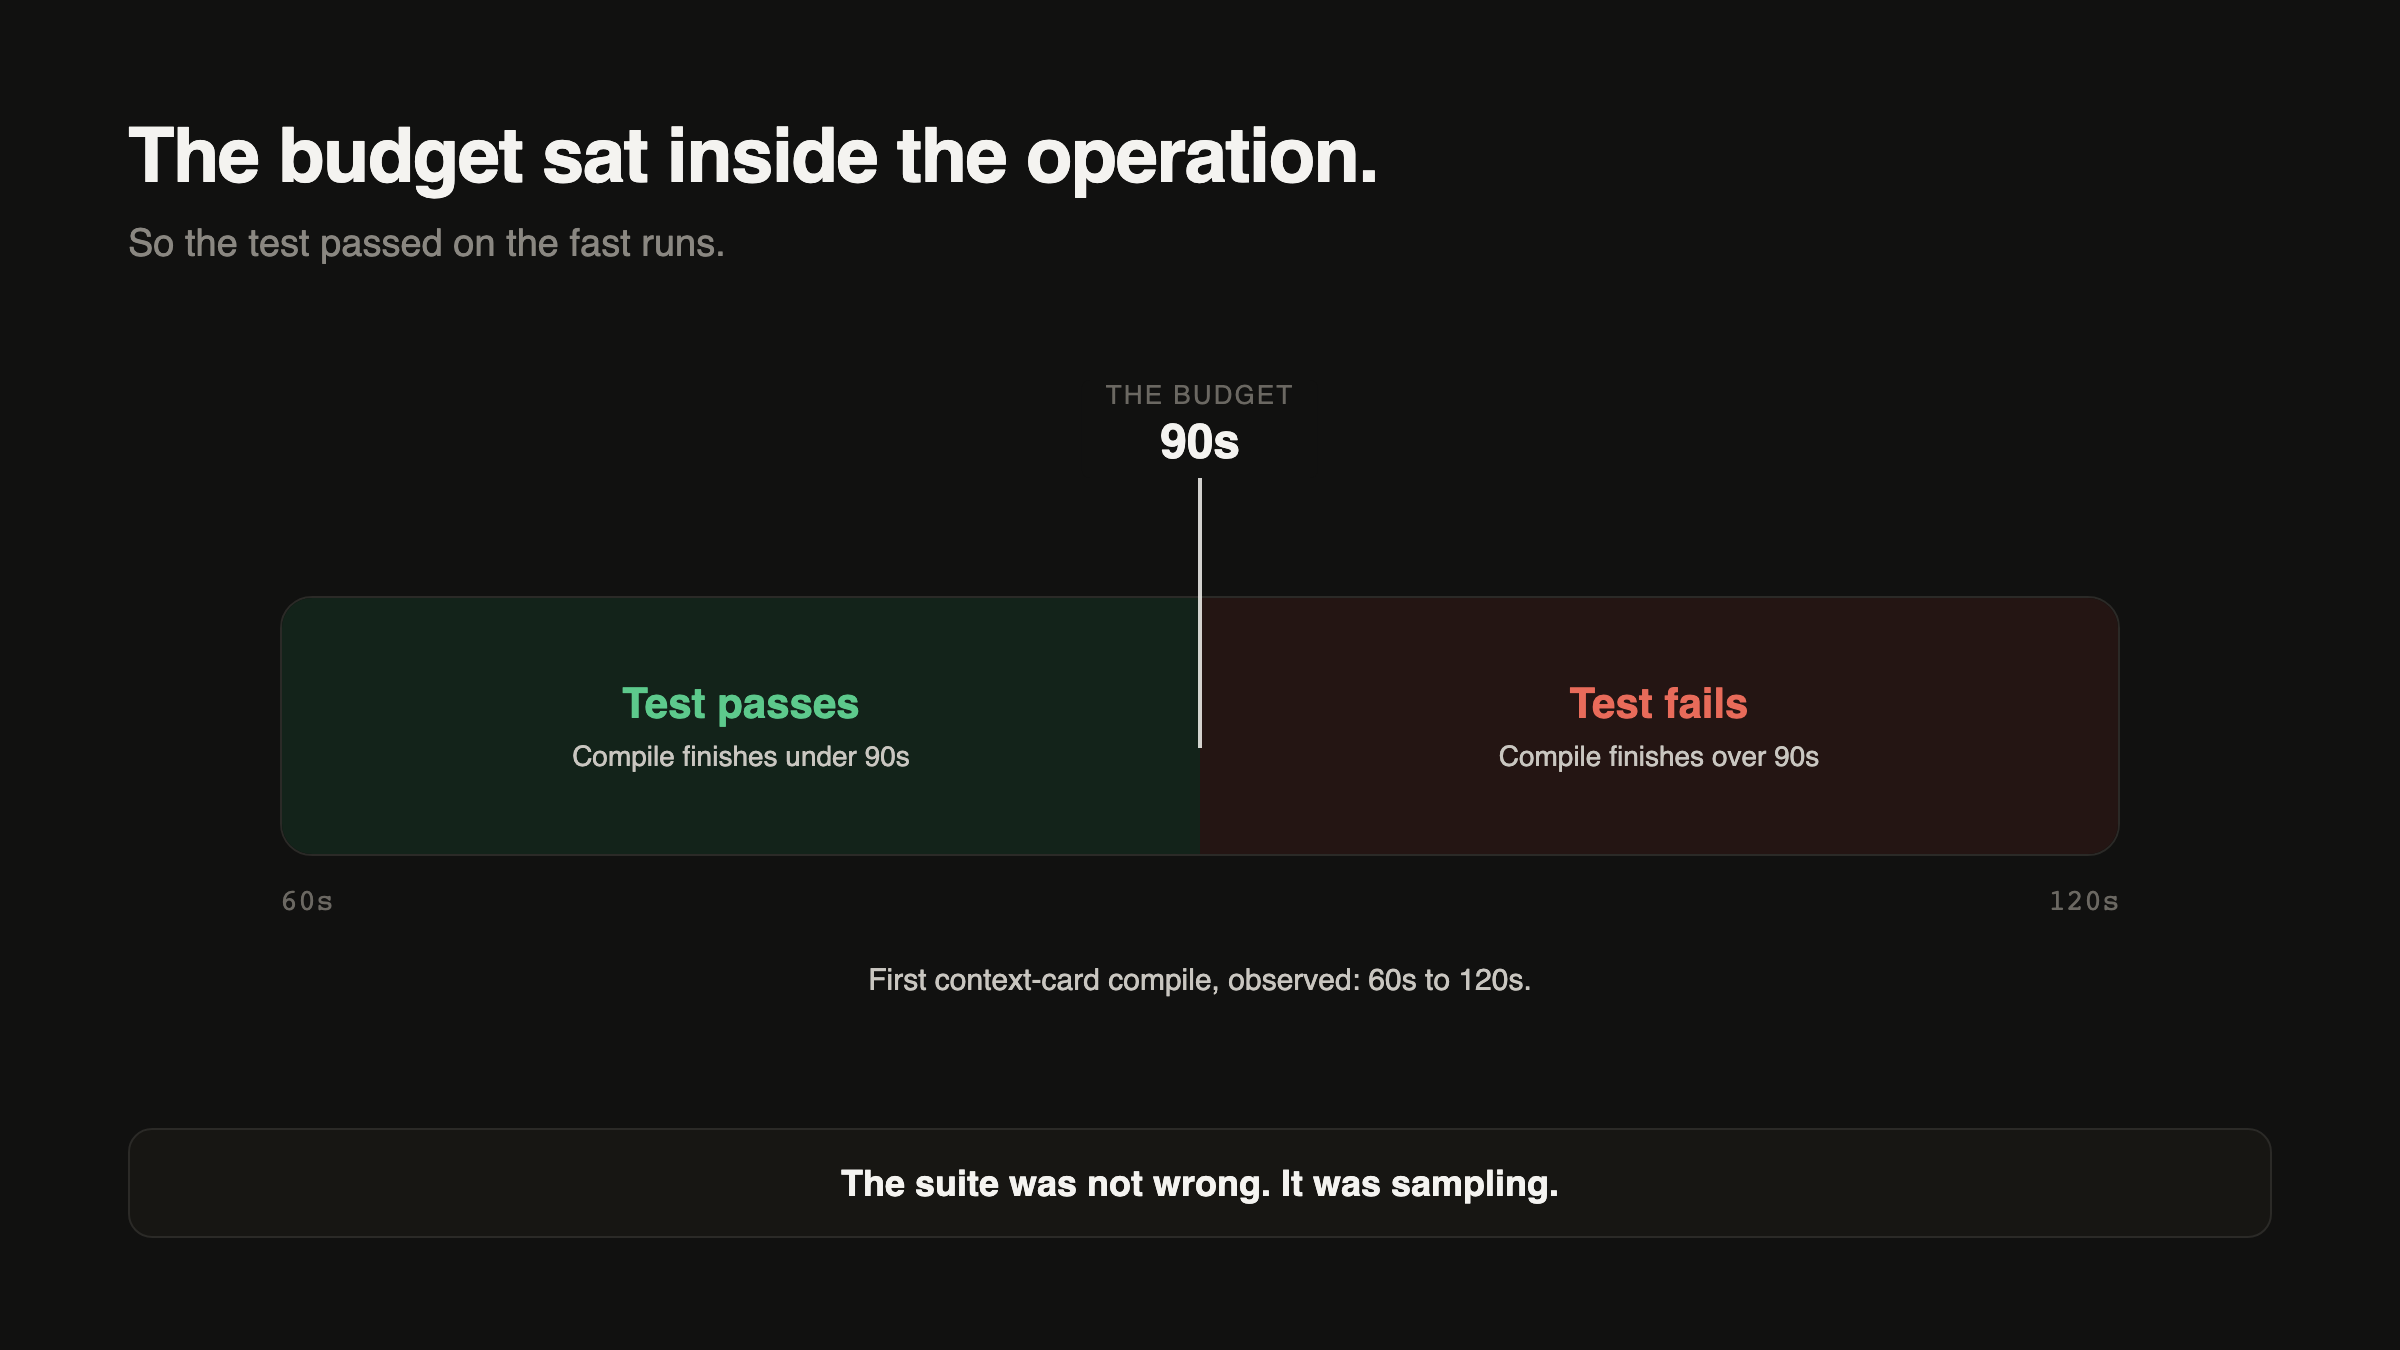
The fix separates compilation from everything else a request does. Instead of one 90 second ceiling covering authentication, context assembly, agent invocation, and response handling as a single block, compilation now gets its own budget, set to 300 seconds and configurable independently of the request budget that governs the rest of the pipeline. A slow first compile no longer competes with the same clock a fast cached read uses. The general point survives past this one bridge: any budget whose number sits inside the observed range of the thing it is timing is not really a limit, it is a coin flip dressed up as a limit, and a suite that samples that coin flip a handful of times will report whatever side came up more often that day.
What happens when a readiness check does the work it is checking?#
/health called the same function that compiles a context card, getCard(), which meant a readiness probe hitting a cold cache would trigger a full compile and block for however long that compile took, the same 60 to 120 seconds from the section above, before answering at all. A readiness check exists to answer one question fast: is this service in a state where it can be trusted to take real traffic right now. A readiness check that spends two minutes compiling before it answers has stopped being a readiness check and become a second, disguised entry point into the same slow path it was meant to guard against.
Every test in the suite that called /health did so after something earlier in the same test run had already compiled the card, because that is the natural order a test file executes in, one test after another, sharing a process and therefore sharing whatever the first test happened to warm up. The cache was never cold when a test asked /health a question, so /health was never slow when a test asked it. On a freshly started machine, before any other request had touched the cache, the exact same endpoint would have blocked for minutes on its very first call, which is precisely the moment a readiness probe is supposed to answer fastest, because that is when an operator or an orchestrator most needs to know whether the service just came up cleanly.
The fix does not touch getCard() at all. It adds a separate check that stats the source files on disk and reads the cache header already written alongside the compiled card, comparing modification times the same way the cache invalidation logic from the previous post already does, without ever invoking the compile step itself. That answer now returns in about 20 milliseconds regardless of whether the cache is warm, cold, or mid-recompile, because stating a file and reading a header cost the same small amount of time no matter what state the cache happens to be in.
The lesson generalizes past health checks specifically: a check that performs the work it is supposed to be checking will always look fast in a suite that has already performed that work earlier in the same run, and it will only reveal what it actually costs the first time it runs on a machine where nothing has warmed it up yet. A readiness probe, a cache check, a warm-up route, anything whose entire job is to answer a question quickly needs to be built so that answering the question and doing the underlying work are two different code paths, or the test environment's own execution order will hide the exact cost that matters most in production.
None of that is something I worked out here. It is settled practice elsewhere, and I had simply not carried it across. The Kubernetes documentation on probes describes the expected shape as a "low-cost HTTP endpoint", which is exactly the property /health had given up the moment it called getCard(), and it is the reason an orchestrator can afford to poll one every few seconds without thinking about it. A probe that is cheap by design can be called constantly. A probe that compiles a context card cannot be called at all on the one occasion it matters most.
Why is a 500 worse than the error it replaced?#
A model response carrying no usable draft, an empty string, a refusal, output that never resolved into anything the bridge could hand back, threw a plain Error with no further structure attached to it. That error fell through the bridge's general handler, landed on the generic 500 branch, and the panel on the receiving end rendered it as "an unexpected status," a phrase that describes nothing about what actually happened and gives a person looking at it no next step to take.
Every test written against this path asserted that the error was thrown. That assertion is not wrong, the error genuinely was thrown, and confirming that the throw happens is a legitimate thing to check. But not one of those tests asserted anything about what a caller receiving that response could actually do with it, which is a different question from whether the throw occurred, and it is the question that determines whether the failure is useful or just noise. A suite can be entirely correct about the mechanics of an error and say nothing at all about its consequences for the person on the other end of the request.
The fix turns that specific failure into a 422 that carries the model's raw text alongside it, the actual words the model produced even when the bridge could not shape them into a usable draft. Nothing about the underlying situation changed. The model still failed to produce a clean result. What changed is that the work the model did produce is now visible instead of discarded, and a caller looking at a 422 with real text attached has something to read, edit, or retry from, where a caller looking at "an unexpected status" had nothing.
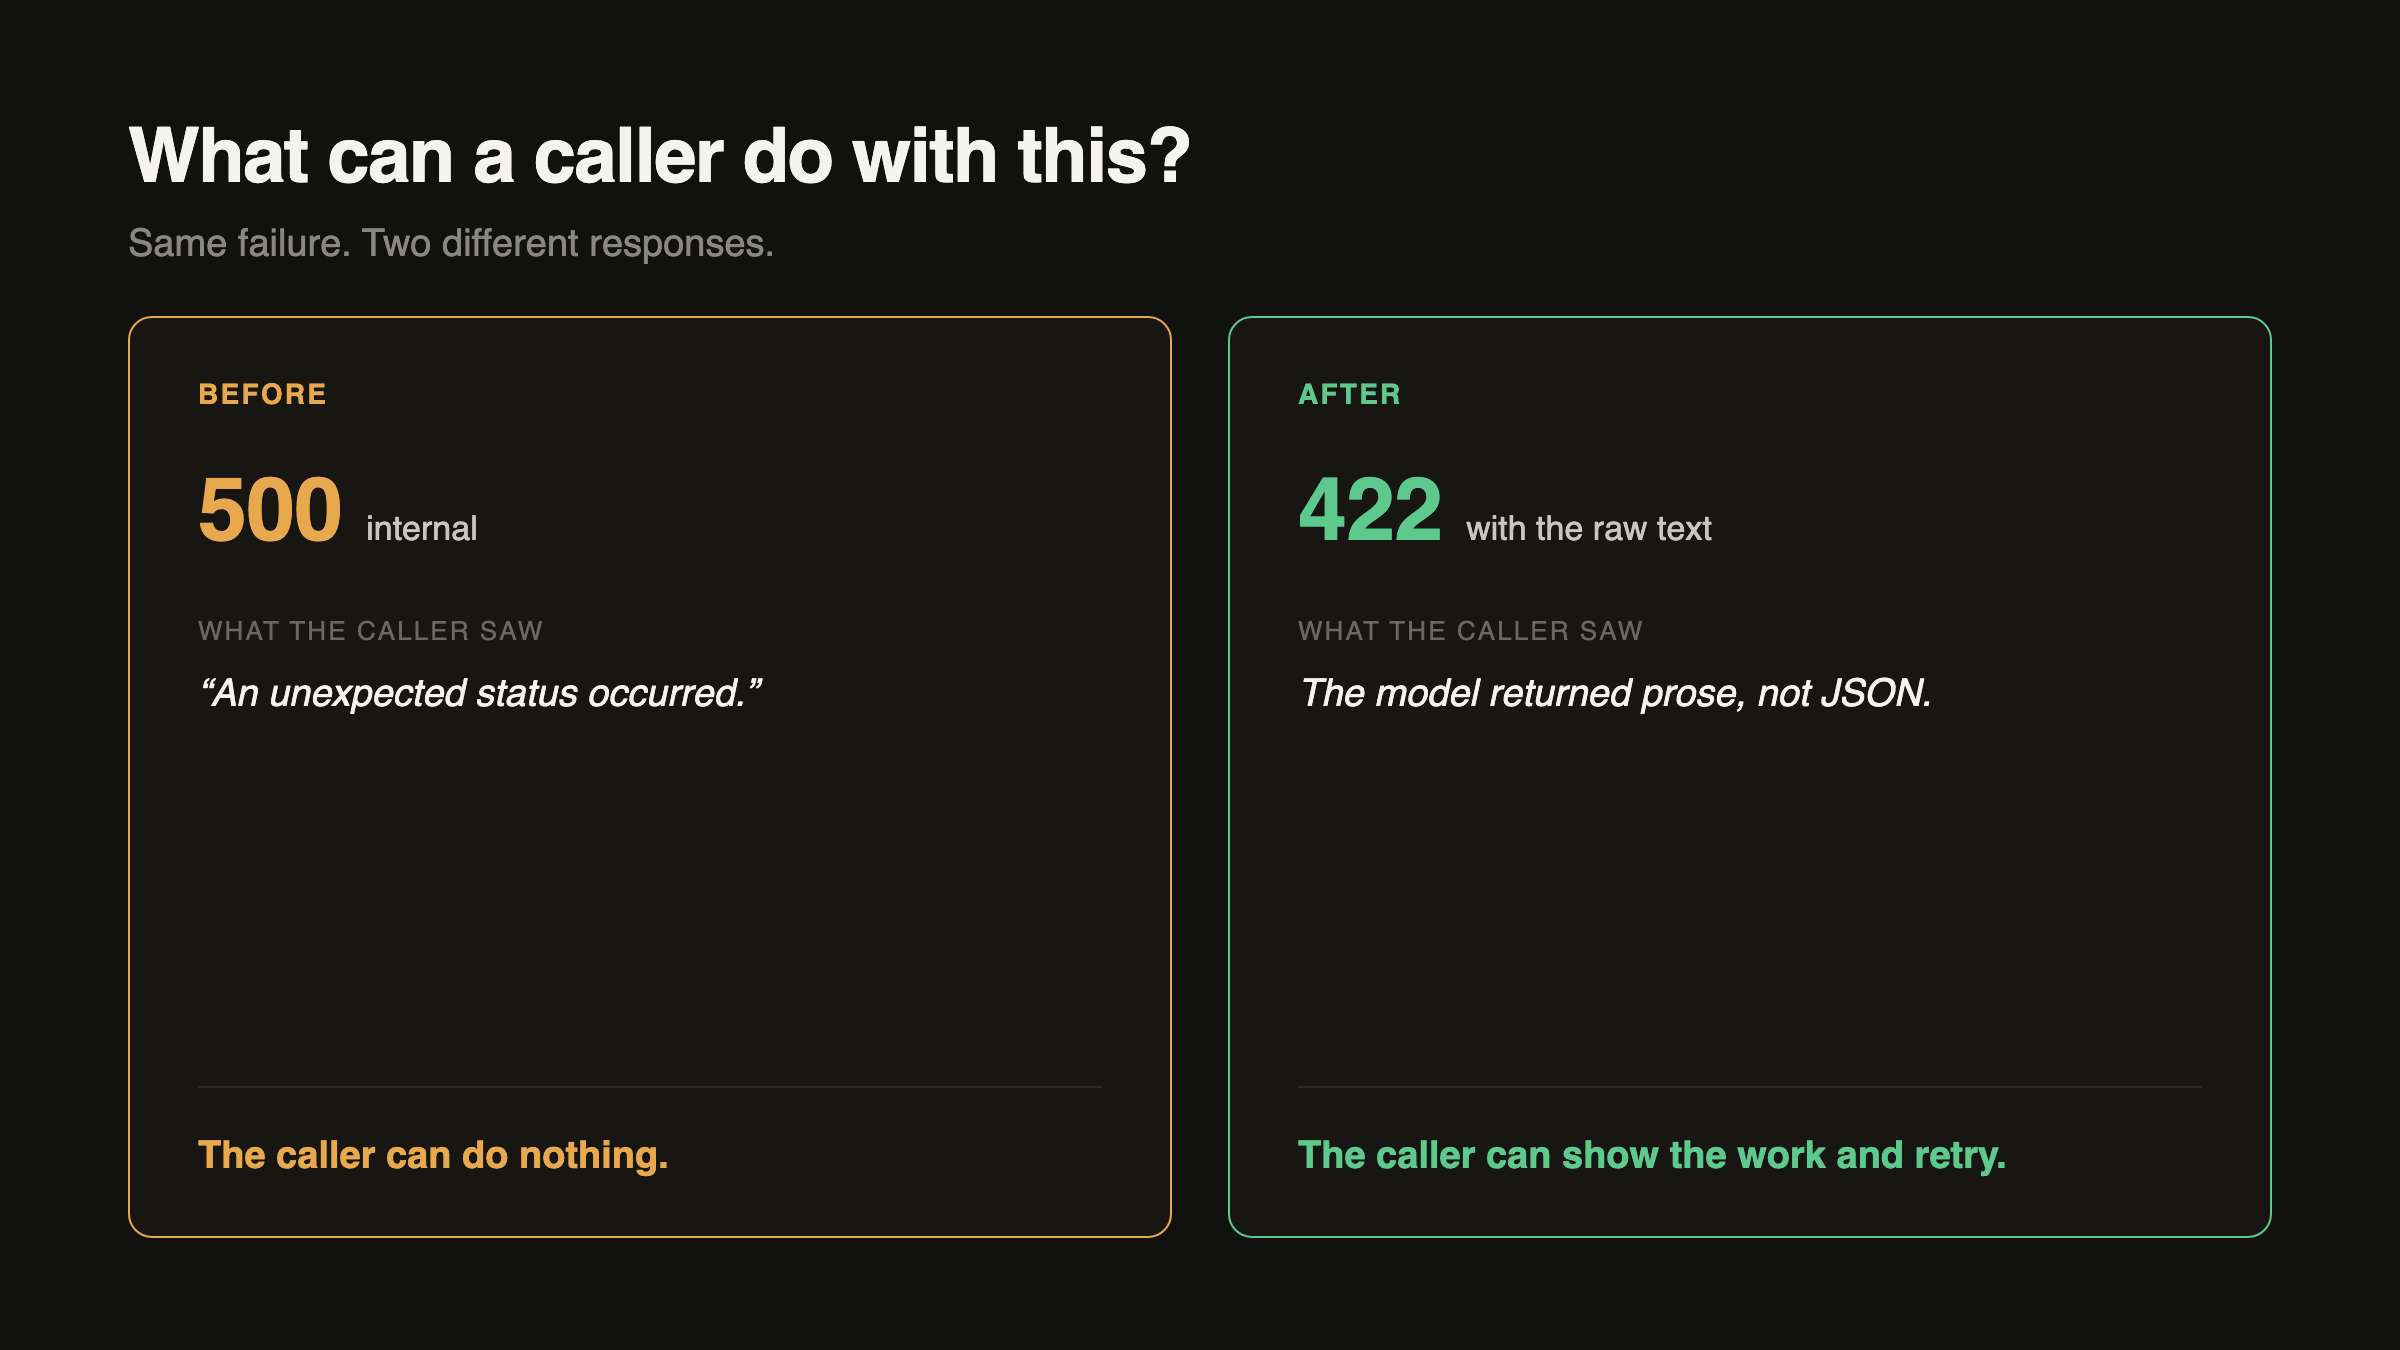
Asserting that an error was thrown only proves the code took an error path instead of a success path. It says nothing about what the caller on the other end of that path can actually do next, and those are two separate questions with two separate answers. A test can pass on the first question, confirming the throw happened, while leaving the second question completely unexamined, namely whether the response gives a human anything to act on. A failure can be correctly thrown and still be useless to whoever receives it, and a suite that only checks for the throw cannot tell those two outcomes apart. Checking what a caller can do with a failure means asserting on the response body a real client receives, not just on whether an exception object exists somewhere in a stack trace. Throwing and being usable are not the same property, and a suite that only ever asks whether something threw is only ever measuring one of them.
The deeper reason this matters is the same one behind the verification burden that AI products tend to ignore: a person receiving a failed response still has to do something with it, and the cost of that something falls entirely on them, not on the system that produced the failure. A 500 with no content hands the caller nothing to verify against and nothing to salvage, which means the entire cost of recovering from the failure, guessing what happened, retrying blind, abandoning the request, lands on a human who was given no material to work with. A 422 with the raw text at least gives that human something concrete to check against their own judgment, which is a smaller burden than reconstructing an answer from nothing.
What do these three have in common?#
None of the three is a logic error. The compile budget math is correct, the health check calls a real function correctly, the error handler correctly throws and correctly returns a 500 for an uncaught exception. Read any one of the three in isolation, purely as code, and there is nothing to flag. What each one actually is, all three of them, is a disagreement between the conditions the test suite constructs and the conditions reality constructs. A suite builds its own small world, one process, one shared cache across tests, one budget checked against compiles that mostly landed on the fast side, and that world is not the same world a single real request lands in on a cold machine at an arbitrary hour. These bugs did not live in the code. They lived in the gap between those two worlds, and no amount of staring harder at the code inside either world would have shown them, because the code was doing exactly what it was written to do in both cases. Only running the second world, the real one, surfaced the gap.
How would you catch this class of bug?#
Run the thing cold at least once, deliberately, outside the shared process a test suite gives every test for free. A fresh cache, a fresh process, no earlier test having already warmed anything up on the caller's behalf. That single condition alone would have caught the health check bug immediately, because a cold cache is exactly the condition the suite never constructed on its own.
Assert on what a caller can do with a result, not only on what code path produced it. A test that checks a response body for something a human could act on catches the gap between throwing correctly and failing usefully, where a test that only checks whether an exception was thrown cannot see that gap at all, because it was never looking at the same thing.
Be suspicious of any budget whose number sits inside the observed range of the thing it is measuring rather than outside it. A 90 second ceiling against a 60 to 120 second operation is not a limit, it is a coin flip with extra steps, and the fix is not a bigger number chosen at random, it is separating what is being timed into its own budget sized to the operation it actually governs, the way the 300 second compile budget now is.
None of these three habits require more tests in the sense of more assertions of the same shape already in the suite. They require different conditions, conditions the existing ninety six tests never happened to construct, because the suite's own execution order and its own shared state kept constructing the same easy world over and over.
| Bug | What the tests said | What reality did | Why the suite could not see it |
|---|---|---|---|
| Compile budget | 90 second ceiling, compile usually finished under it | Compile took up to 120 seconds and the request timed out | The budget sat inside the observed 60 to 120 second range, so pass or fail depended on which side of 90 a given run landed on |
| Readiness check | /health answered quickly every time it was called | A cold cache made /health compile and block for minutes | Every test called /health after an earlier test in the same run had already warmed the cache |
| Empty draft | The error was thrown, exactly as asserted | The caller received a 500 with no content and nothing to act on | Tests checked whether the throw happened, never what a human receiving the response could do with it |
FAQ#
Would more tests have caught these bugs?#
More tests of the same shape as the existing ninety six would not have, because the problem was never a missing assertion inside a scenario the suite already constructed, it was a scenario the suite never constructed at all. A hundred more tests asserting on a warm cache would still never touch a cold one. What would have caught these is a different condition, not a larger count of the same condition, which is a distinction worth holding onto separately from raw coverage numbers.
Is this an argument against writing tests?#
No. Ninety six passing tests caught real regressions across the life of this bridge and will keep catching them, and nothing in these three bugs argues that the suite should not exist or should have been smaller. The argument is narrower: a passing suite answers the question it was built to ask, and these three bugs lived in a question the suite was never built to ask in the first place. Keep the suite. Add the conditions that were missing from it.
What should you test instead?#
Cold state instead of only warm state, a fresh process instead of only a shared one, and the content of a failure response instead of only the fact that a failure occurred. None of that replaces the existing ninety six tests. It sits alongside them, aimed at the specific gap between the world a suite builds for itself and the world a single real request runs into on a machine nobody warmed up first.
Does three bugs from one afternoon actually mean anything?#
Honestly, not in the way a study would mean something. This bridge was built in a day and run for one afternoon before these three surfaced, which is not a sample size anyone should generalize a failure rate from, and it says nothing about how often this class of bug shows up in agent bridges broadly or in this bridge over a longer stretch of real use. What it does show, directly and without needing a larger sample to support it, is that a green suite of ninety six tests coexisted with three bugs a single afternoon of ordinary use found within hours. That coexistence is the fact worth taking from this, not a rate, not a trend, just the plain demonstration that green and working are not the same claim.
How do you test something whose timing varies from one run to the next?#
Test the boundary directly rather than trusting a single run to land on the correct side of it. Force a compile that takes longer than the budget and confirm the budget actually trips, instead of relying on an unforced compile to sometimes exceed it and sometimes not. A budget that has never been deliberately exceeded in a test has never actually been tested, no matter how many times the suite around it has passed.
Did fixing these three bugs require rewriting the bridge?#
No. Each fix was small and local: a second budget value for compilation, a stat-and-read check that avoids the compile path entirely, and a different status code carrying the model's raw text instead of discarding it. None of the three required an architectural change. What one of them did produce is the 422 row that the taxonomy in the previous post now presents as if it were designed in from the start. It was not. It was finished by an afternoon of real use. The bugs were narrow, and so were the fixes.